

Trying to get my data science and machine learning knowledge more caught up with my colleagues at CCRi, I have been regularly listening to the podcasts Talking Machines and Linear Digressions. One colleague recently recommended Data Skeptic, which I had tried before and didn't get hooked on, but after listening to their episode on Activation Functions I am now hooked. I am so hooked that I am going back through their four-year history and listening to all of their episodes marked "[MINI]"; these are shorter episodes focused on single specific important concepts, like the activation function episode.
In my blog entry A modern neural network in 11 lines of Python last December, I quoted Per Harald Borgen's Learning How To Code Neural Networks, where he says that backpropagation "essentially means that you look at how wrong the network guessed, and then adjust the networks weights accordingly." I now understand better about a key design decision when making that adjustment. (All corrections to my explanations below are welcome.)
You can't adjust the weights with just any old number. For one thing, they usually have to fit within a certain range. If your input value is between 1 and 5000 and the adjustment function expects a number between 0 and 1, you could divide the number by 5000 before passing it along, but that won't give your model much help adjusting its future guesses. Division is linear, which means that if you plot a graph where the function's inputs are the x values and the outputs for each input are the corresponding y values, the result is a straight line. (Some technical definitions of linearity consider that one to be overly simplified, but the Wikipedia entry is pretty close.) Combining linear functions just gives you another linear function, and a neural network's goal is to converge on a value, which requires non-linearity. As Alan Richmond wrote in A Neural Network in Python, Part 2: activation functions, bias, SGD, etc., without non-linearity, "adding layers adds nothing that couldn't be done with just one layer," and those extra layers are what give deep learning its depth.
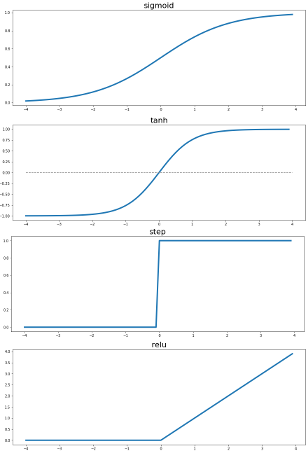
So, squeezing the input value down within a particular range won't be enough. The sigmoid function that I described last December maps the input value to an S-curve so that greater positive values and lower negative values affect the output less than input values that are closer to 0. Ultimately, it does return a value between 0 and 1, and that's what the 11-lines-of-Python network used to adjust weights in its earlier layer.
For some situations, through, instead of a value between 0 and 1, a value between -1 and 1 might be more useful--for example, if there is a potential need to adjust a weight downward. The hyperbolic tangent function also returns values that follow an S-curve, but they fall between -1 and 1. (While the regular tangent function you may have learned about in trigonometry class is built around a circle, the hyperbolic tangent function, or tanh, is built around a hyperbola. I don't completely understand the difference, but when I look at a graph of the regular tangent function, I have a much more difficult time picturing how it would be helpful for tweaking a weight's value.)
When you choose between a sigmoid function, a tanh function, and one of other alternatives mentioned below, you're choosing an activation function. The best choice depends on what you're trying to do with your data, and the knowlege of what each can do for you is an important part of the model-building process. (The need for this knowledge when building a machine learning model is one reason that machine learning cannot be commoditized as easily as many people claim; see the "MLaaS dies a second death" section of Bradford Cross's Five AI Startup Preductions for 2017 for an excellent discussion of some related issues.)
The Data Skeptic podcast episode covers two other possible activation functions: a step function, which only outputs 0 or 1, and the Rectified Linear Unit (ReLU) function, which sets negative values to 0 and leaves others alone. ReLU activation functions come up in a Jupyter notebook that accompanied the CCRi blog entry Deep Learning with PyTorch in a Jupyter notebook that I wrote last May, and they also appear in an earlier, more detailed draft of a recent CCRi blog entry that I edited called Deep Reinforcement Learning-of how to win at Battleship. Both times, I had no idea what a ReLU function was. Now I do; maybe I am catching up with these colleagues after all.
If you want a better understanding of the choices developers make when designing neural network models to solve specific problems, I strongly recommend listening to the Data Skeptic podcast episode on activation functions, which is only 14 minutes. I especially liked its cornbread cooking examples, where questions of how much you might adjust the amount of different ingredients provided excellent examples of which activation functions would push numbers where you wanted them.
Images from Data Skeptic podcast page are CC-BY-NC-SA
Please add any comments to this Google+ post.